
It was in the winter of 1973; I became a member of the Enasan Tunnel project. As a basic researcher in the traffic flow theory, ventilation of road tunnels was a completely new system for me.
It is natural to think that it is important to understand the traffic flow in the tunnel in order to deal with tunnel ventilation, because the source of the polluted gas in the tunnel is the vehicles in the tunnel.
From the literature review from overseas, I found many documents that are up-to-date at the time, such as “Estimation method for traffic in road tunnels” and “Traffic flow control on highways”1),2),3),4),5). Among them, I was strongly interested in the paper that Mr. D.C. Gazis of IBM succeeded in understanding the traffic flow in New York’s Lincoln Tunnel using a computer.1),2).
This involved installing traffic meters at the entrance and exit of the tunnel and using the data to estimate the number of vehicles in the tunnel and the average vehicle speed.
In order to apply Gazis’ method of estimating regional traffic flow to the Enasan tunnel, confirmation verification on Japanese highways cannot be avoidable. Fortunately, thanks to the understanding and support of Section manger U of the Enasan construction office, I was given the opportunity to confirm and verify this. The experiment site is in open are located between the Tennozan and Kajiwara tunnels on the Meishin highway. The 2km section between the overbridge called Gyelin Bridge and the Tennozan tunnel gate, which was located at the light at that time, was targeted for verification.

All the passing times and speeds of vehicles passing through these two points are measured in two lanes (lane by lane). A person assigned to each location recorded the passing time with a clock and the speed with a radar Doppler sensor. The number of vehicles in this section was counted by photos taken with a camera equipped with a telephoto lens (1000 mm) and an automatic shutter (1 minute timer), with people placed at 3 points on the Takenoko Mountain north of this road section.
This experiment was conducted from March 5 to 7 in 1974. A total of more than 20 members of the experiment gathered in the evening of March 5 in the Sodo hall of Hoshakuji Temple on Mt. Tenno, where they stayed. On March 6, it rained heavily in the morning, forcing them to cancel the experiment. On the morning of March 7, when the rain stopped at 6:00, all the staff were deployed and the data was acquired from 7:00. On the morning of March 7, when the rain stopped at 6:00, all the staff were deployed and the data was acquired from 7:00 to 9:00. (After 10:00, it rained heavily again, I had no choice but to cancel the Photo Shoot.)
The valuable data obtained from this experiment played an important role in the subsequent direction of the project. The experiment also served as a crucial point for fostering teamwork, which is essential for the progress of the project.
The following diagram shows the results of confirming Gazis’ method using this measurement data.
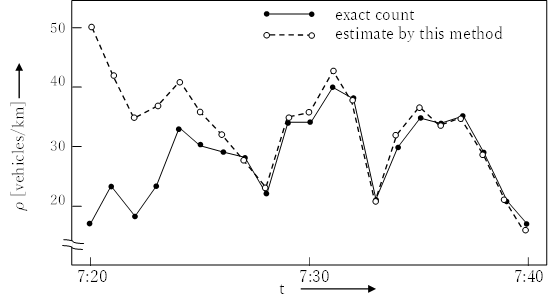
In this figure, the number of vehicles measured from photographs taken at Mt Takenoko(●mark) and the number of vehicles estimated from measurement data of passing vehicles measured at the Niwatori bridge and the Tennozann portal(〇mark) are shown.
Assuming that the number of vehicles at 7:20 was 50, it can be seen that at 7:30, the number of vehicles marked with ○ (estimated number of vehicles) is almost the same as that marked with ● (actual number of vehicles measured). This result confirms the usefulness of Gazis’ method for estimating sectional traffic condition.6)
In April 21,1974, one month after the Tennozan experiment, I departed to San Francisco from Haneda. This was my first overseas business trip. It was to present a paper on traffic flow allocation at the IEEE’s Circuit Theory Conference (ISCAS) in San Francisco.7)
During this trip, I had got the opportunity to observe the ventilation control system of the Lincoln Tunnel, New York, through the introduction of W, Deputy Director General of the Japan Highway Public Corporation. In Lincoln Tunnel, they adopted method (manual control system) in which the operator determined the amount of ventilation based on traffic volume. After visiting the Lincoln tunnel, I visited Mr.Gazis at the IBM Watson Research center in Northen part of New York. Mr.Gazis and Collogues welcomed me and listened to the story about the Tennozan tunnel experiment.
Through the experience of this overseas business trip, I learned that engineers who share technical themes can communicate common skills even if their languages skills are not high. This was a great support for the rest of my life. (Continue)
Referencs:
1) D.C. Gazis and R.S.Foote, “Surveillance and control of tunnel traffic by an on-line digital computer” Trans. Sci., 3-3, P255-275 (1969)
2) D.C. Gazis and C.H.Knapp, “On-line estimation of traffic densities from time-series of flow and speed data” Trans. Sci., 5-3, P283-301 (1971)
3) N.E.Nahi and A.N.Trivedi, “Recursive estimation of traffic variables; section density and average speed” Trans. Sci., 7-4, P269-286 (1973)
4)L.Isaksen & H.J Payne, “Freeway traffic surveillance and control” Proceedings of the IEEE, 61-5, P526-536(1973)
5)L.Isaksen & H.J Payne, “Suboptimal control of linear systems by augmentation with application to freeway traffic regulation” IEEE.Trans., AC-18-3, P210-219(1973)
6) Kotaro Watanabe, Ichiro Nakahori etal.”Experimental Study of Vehicle Density Estimation Method on Expressways”Mitsubishi Electric Technical Report 94-4 P254-258 (1975)
7) I.Nakahori and S.Handa, ”Traffic Assignment with a piece-wise Linear Road Characteristic” IEEE International Symposium on Circuits Systems, San Francisco (1974)